Showing posts with label resource efficiency. Show all posts

Thursday, July 11, 2013

THE POWER OF RESOURCE EFFICIENCY AS A COST REDUCTION STRATEGY

Resource Efficiency is one of the most
powerful cost reduction strategies
available to manufacturers
Manufacturing sites are generally thought of as having two major types of costs: Fixed Costs, which tend to be largely independent of the level of production, and Variable Costs, which are intrinsic to each unit of production, and therefore tend to increase or decrease in direct proportion to the level of production. Fixed costs would entail costs such as rent, salaries, protective clothing and the like. Variable costs would include the costs of raw materials, water, energy and other resources.

This is the traditional way in which costs are viewed. In reality, it is however not quite so simple. For example, wage bills can vary with production as a result of overtime. Operating staff use a certain amount of water (which can be considered to be fixed) each month for ablutions and energy costs associated with lighting and administration also tend to be fixed.  Hence even costs that are commonly considered as variable costs do have a fixed component. As a result, it is not uncommon for the unit costs of these resources to increase significantly at low levels of production as the fixed components of these costs becomes a bigger proportion of the total cost per unit.  In the case of resources, technology does however exist which we can use to engineer the fixed components out to a large degree. A simple example would be the use of a variable speed drive to control the speed of a screw compressor to allow it to vary capacity with demand.


If you have worked in manufacturing for any length of time, you will have seen that manufacturing plants tend to perform best when capacity is fully utilised, and that it is at low levels of production that meeting cost budgets linked to the level of production becomes most difficult. This is partly explained by the fact that equipment and processing plants tend to operate more efficiently when running at design capacity levels.  The second more obvious reason is that the fixed component of the cost is spread over more units of production, diluting its contribution.


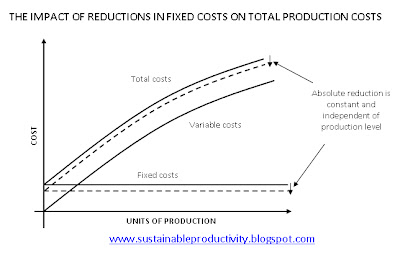
In practice, at very high levels of production the variable and total cost curve could experience a sharper rate of increase as the facility becomes strained under throughput levels that exceed design levels. The unit cost curve could then start to look something like the one illustrated below.


In economic times like the ones we are experiencing now, cutting costs is a vital strategy if businesses are to survive. Costs can be attacked from the perspective of both the fixed and variable components of the total cost. Fixed costs are largely comprised of salaries and wages, and while this is generally an area heavily targeted for restructuring exercises, this does come at a moral cost as well as a reduction in human capacity within organisations, not to mention the morale impacts on those left behind. It would be naive to think that staff numbers could be reduced with no impact on productivity, or without knock-on impacts on variable costs. For example, losses in expertise and tacit knowledge could lead to an increase in material usage.

The variable cost elements in manufacturing tend to be largely in the area of resource consumption. For example, each unit of production tends to require a given amount of raw material. The energy required to transport and process these materials tends to increase in proportion to production levels, as does the water needed. Of course, the picture is made more complex by the needs of individual products, and changes in the mix of these products over time. However, in general terms, increased resource efficiency tends to result in reductions in variable costs.

Let’s look for a minute at how reductions in fixed and variable costs impact on the total costs of production.


In the case of fixed costs, absolute reductions are independent of the level of production. Whether a site produces 100 units or 100,000 units, the quantum of the cost saving will be the same, assuming of course that the fixed cost reduction has no negative side effects. Hence the percentage reduction in costs per unit is diluted as the level of production increases.

In the case of variable cost reductions, an entirely different picture emerges. Since the cost reduction is associated with each unit of production, the total value of the savings realised increases with each additional unit of production. For high-volume manufacturing operations, the benefits multiply quickly and can have an enormous positive impact on the financial performance of the enterprise. 


How then are these variable cost reductions realised? The following are the primary opportunities available to reduce variable costs from a resource efficiency perspective. The examples outlined are energy-related, but the principles would apply to materials and water too:
  • Optimise the existing plant through changes to process setpoints e.g. temperature and pressure settings
  • Change work practices regarding plant operation to make the plant more efficient  e.g. employing a de-fouling procedure to increase heat transfer rates across a piece of heat recovery equipment
  • Improve plant maintenance practices, thereby reducing waste e.g. instituting a compressed air leak detection and maintenance programme
  • Modify the plant to improve its efficiency e.g. installing a variable speed drive on a pump to save energy when flow is reduced, rather than incurring a pressure drop across a control valve
  • Make significant technology investments to foster resource efficiency e.g.  installing a condensing economiser on a gas-fired boiler to recover heat from flue gases
The significant difference between these variable cost reduction options and fixed cost reduction options is that there are typically no negative side effects to contend with. In the case of an option like optimisation, since costs are negligible, the financial benefits are profound, but this can also be the case for many opportunities requiring capital investment. The biggest positive aspect of resource efficiency as a cost reduction strategy is however the multiplier effect achieved due to its focus on variable costs. And if you can find viable resource efficiency projects in this economic climate when volumes in most manufacturing businesses are depressed (and I know from experience that this is eminently possible), imagine the impact on your bottom line when volumes pick up and that multiplier effect magnifies the total savings achieved.  

Copyright © 2013, Craig van Wyk, all rights reserved

Tuesday, February 5, 2013

VARIABLE SPEED DRIVES AND THEIR USE IN RESOURCE EFFICIENCY AND CLEANER PRODUCTION

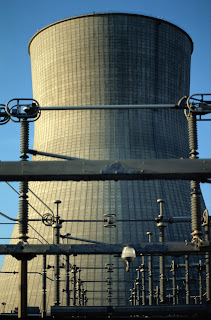
Forced draft fans in dry cooling devices
like the one pictured can be fitted with
VSD's  to allow them to  vary speed in
response to climatic conditions or
tower performance

The speed of an induction motor is a function of its number of poles and the frequency of the power supply. Variable speed drives (VSD’s) – also called variable frequency drives (VFD’s) – are used to vary motor speed by changing the frequency of the alternating current and voltage applied. They have many uses in industry, which is to be expected given the wide range of potential applications for continuous speed control within industrial processes.

VSD’s may be controlled through the intervention of a plant operator, using an interface such as a simple button/knob which can be used to increase and decrease speed, or through a SCADA system, which can be used to manually changed the frequency output. Generally however, they are used within the context of a control loop, which varies speed automatically in response to an output from some other measured variable. For example, pump speed could be varied in response to the output from a flow meter in the pipeline carrying the fluid being pumped. Alternatively, frequency setpoints could be written into control software based on the status of the process being controlled. For example, agitator speed could be set to a minimum value while a vessel is being filled, with the speed increased after filling has been completed. There are an infinite number of ways that VSD’s can be employed in control schemes such as this. Just a few examples of common applications are:
  • Changing the speed of agitation in a mixing vessel
  • Changing conveyor speed on a production line
  • Changing the speed of a pump (and hence the flow) in fluid handling
  • Changing the speed of a compressor
  • Changing the speed at which racks are lifted from baths in electroplating
  • Changing the pressure inside a boiler (on the fireside) by changing the speed of FD and ID fans.

So far I have discussed how VSD’s give us more control over industrial processes, but what then is the contribution of VSD’s to industrial sustainability? For one, improved control means reduced rework, which translates into reduced consumption of energy, water and materials. VSD’s are however probably more recognised for their growing use in industrial applications on the basis of the energy savings they provide. Simple examples include their use to control poorly loaded screw compressors (minimising “off-load” losses), and their use in controlling the speed of fans (where flow is directly proportional to speed, but power varies with the cube of speed). Controlling fluid flow by manipulating pressure drop (e.g. the use of a control valve or damper in conjunction with a pump or fan running at a fixed speed) consumes far more energy than that required were a VSD used to control pump or fan speed instead. VSD’s also provide exceptional “soft start” capabilities (while using less energy than traditional soft starters) and can also be used to control torque characteristics and to boost torque (e.g. at start-up).  While there are losses incurred in using a VSD (of the order of 1 – 3%) the efficiency gains at the system level arising from their use generally far exceed these. As far as energy efficiency projects involving induction motors go, I tend to find many more viable opportunities through VSD applications than I find in areas such as motor replacement.

VSD’s are however far more versatile from a sustainability point of view than simply being an electrical energy efficiency tool. Their use in material usage reduction can yield spectacular results where correctly applied. Consider the following drivers of material usage in the industries in the table below, and how VSD’s can be applied to improve material usage performance:

INDUSTRY
PROCESS
DRIVER OF MATERIAL USAGE
HOW TO EMPLOY A VSD
Drum manufacturing/reconditioning
Spray painting
The speed at which drums are rotated during spray painting is an important driver of paint thickness.
Install a VSD and allow the operator to manipulate drum speed to control paint thickness, along with other variables such as solvent ratio, air pressure and nozzle design.
Powder coating
Curing
Curing time and temperature affects curing quality and rework rates
Install a VSD on the conveyance system to permit variations in residence time in the curing ovens for items of different dimensions. To be used in conjunction with oven temperature profile.
Waste management
Oil recovery in a plate separator
Residence time in the plate separator impacts on efficiency of oil recovery
Use a VSD on the supply pump and vary the flow based on the composition of the incoming effluent, thereby changing the residence time. A turbidity meter in the separator outlet could be used for automatic feedback control.
Batch chemical manufacturing
Material dosing
Accuracy with which individual chemicals are added to a batch
Use VSD’s on dosing pumps (liquids) and screw conveyors (solids)  to vary dosing rate, slowing down the flow as the target value is reached and eliminating overshoots

How else could VSD’s be employed? The answer is really that the opportunities are limited by your creativity. There are few manufacturing processes in which speed is not an important variable, and the first thing to understand is: “what is the impact of speed on the process being analysed?”. Armed with this understanding, the next question would be: “does a VSD, with its ability to provide speed control over a continuous range, provide leverage in terms of reducing resource consumption and minimising pollution?” In my experience, the answer is very often a resounding “yes”. Your final consideration would be whether this leverage/benefit justifies the investment in the VSD. In real terms, VSD’s have become cheaper over time, despite gains in the features they offer. Combine this fact with the significant benefits they can provide, and they are often easy to justify from a financial and environmental perspective. 

Monday, January 21, 2013

HAVE YOU ESTABLISHED YOUR SITE'S RESOURCE EFFICIENCY BASELINE?

A Resource Efficiency Baseline is a 
point of departure for your efforts to 
save energy, water and materials.

Resource efficiency is an important aspect of industrial sustainability, not least because it is an area which delivers direct financial benefits by reducing the variable costs of production. The resources referred to here are energy, materials and water, all of which are undergoing significant price increases in most parts of the world. In my country, South Africa, electricity prices as at January 2013 have roughly tripled in the last 5 years, and are set to increase at rates above inflation for the foreseeable future. Rising energy prices increase extraction and transport costs, and spill over into the cost of materials. Water scarcity is a widespread global issue. Economics aside, the life cycle benefits of resource efficiency in terms of reducing emissions, improving water security and reducing the impacts of depletion are significant. No industrial organisation should therefore be without strategies and programmes to continuously improve the efficiency with which resources are used.


Site-specific resource efficiency is not the only aspect of resource management on the industrial sustainability agenda. Through the use of approaches such as life cycle analysis and the analysis of value chains, organisations can identify hot spots in their supply chains where environmental impacts are most severe, and target these to limit the extent of their footprints.  The results of such an exercise can be very surprising – for example, SABMiller’s South African operations found that water use in the agricultural part of their value chain far exceeded that at their breweries (see the report). Life cycle analysis should also prompt companies to find alternative materials, and in some cases fundamentally change their products and processes. The lead times for making such marked changes are however fairly long, unlike typical time-frames for site-specific resource efficiency projects. They should nevertheless be pursued in parallel with site-specific resource efficiency projects, given that the scale of the benefits is potentially very large.

In tackling site-specific resource efficiency, an important first step is to establish the RESOURCE EFFICIENCY BASELINE for your site. Establishing a baseline is primarily a quantitative process, involving an assessment of the quantities of each resource that are consumed on the site, with the data disaggregated as far as possible. These quantities should be expressed in absolute terms (e.g. total kWh of energy used per annum) and then also on the basis of activity (e.g. kWh/ton of production for a given time horizon). Since individual products can also use very different amounts of resources for their production, you may want to factor product mix into your baseline assessment. This is in my view an extremely important consideration, albeit one that is not necessarily simple to incorporate, particularly where sub-metering is not in place. A workable approach is perhaps to use a reasonable allocation procedure based on sensible calculations, and ensure that the individual usages tally to the total usage. 

To understand what I mean by "disaggregated data", consider energy as a simple example. Most industrial sites I visit use at least 3 different energy carriers, sometimes more. In addition to knowing the total energy consumption, one would also want to know how much of the total energy consumption was in the form of electrical energy, how much was due to the consumption of boiler fuel (and here you would want to disaggregate the data further into individual fuel types) and so on. Within each energy carrier, you would also want to understand how much energy was used by individual process areas, and possibly by individual types of energy-consuming equipment. Hence for electrical energy, it is useful to have a sense of how much energy is consumed by induction motors, how much by heating, how much by lighting etc. and to do this by area as far as possible. To do so may require some measurement (always the best option), or where this is not possible, some intelligent estimates. 

You may also want to delve deeper into specific areas, adding some qualitative data into the baselining exercise. For example you may choose to quantify the total number of induction motors on site, their capacities and other details such as the nature of their drive systems. Some of this information may already reside in your computerised maintenance management system (CMMS) should you have one, though often the information captured for preventive maintenance purposes may be short of details applicable to resource efficiency. This aspect of the baseline is not so much a case of using the data to establish trends as it is a case of building up a profile/technological footprint for the site, and providing context. Think of this profile as a living record that can be updated over time as circumstances change and more detailed information is gathered.  It really is up to you in terms of how detailed your analysis is, and as a rule, the more information you can gather, the better. Over time, you will begin to establish linkages between performance and the nature of the assets employed, facilitating problem solving.

The more meaningful you can make the baseline in terms of the richness of the data, the more focused you can be in choosing areas for the subsequent processes of opportunity identification and development. Consider that resource efficiency opportunities can involve technology, work practices, process optimisation, operating procedures and other factors. This should be reflected in the type of data you gather in constructing your baseline. The process is also instructive in terms of determining the nature of the routine reporting that should be taking place as regards resource efficiency. 

Many organisations propose and report on specific goals in terms of energy efficiency, emissions, water use and other indicators of resource efficiency in their sustainability reports. Their intentions are no doubt noble, but without a well-constructed baseline, formulating such goals, actively pursuing them and monitoring progress against them is virtually impossible. 

Monday, February 13, 2012

TAKING A SYSTEMS VIEW OF RESOURCE EFFICIENCY – A SIMPLE EXAMPLE FROM THE BREWING INDUSTRY


Making the linkages between sub-systems is
important for overall resource efficiency
A fundamental principle of Cleaner Production is to optimise systems rather than individual system elements. When partitioning a system into sub-systems for analysis, it is important to draw a boundary around the broader system you are analysing to ensure that in dealing with resource efficiency problems in one part of the system, you are not introducing unintended consequences elsewhere. I will use the example of centrifugation in the brewing industry to show how resource efficiency impinges on other operational issues such as product quality and throughput, and how taking too narrow a view can result in unexpected problems. If a systems view is not taken, these problems are difficult to solve, and could actually result in a negative overall efficiency position for the system despite apparent efficiencies in an individual area.

Centrifugation is a common unit operation in industry and is used to separate materials of different densities through the application of centrifugal force. It is applied globally in the brewing industry to separate yeast from green beer, with the beer than passed on to additional clarification processes such as filtration. Disc stack centrifuges use conical discs stacked on top of each other, with the product to be clarified passing through the spaces between the discs. As the centrifuge bowl rotates at high speed, yeast is pushed against the inner surfaces of the discs and is forced downwards into solids pockets in the bowl. The clarified beer passes up the centrifuge and exits, while separated yeast accumulates in the centrifuge. This yeast is periodically removed by momentarily opening the bowl and then shutting it to prevent an excessive loss of beer.  This process (called “de-sludging”, “discharging” or “ejection”) is well illustrated by this short video
There are a number of ways to initiate a centrifuge discharge. One way is through the use of a timer, in which case the centrifuge bowl will open and shut at a pre-determined frequency. This is not really desirable, since it leads to variations in the concentration of the yeast slurry discharged and in the clarity of the centrifuged beer. The second is through the use of in-line instruments which measure the clarity of the beer passing through the centrifuge, and then prompt a discharge when this clarity level becomes unacceptable i.e. when there is too much yeast in the beer exiting the centrifuge. Turbidity meters are an example of a typical instrument that can be used in this application, and work by measuring the amount of light absorbed by the beer, which is considered to be inversely proportional to its clarity. The turbidity level in the beer exiting a centrifuge tends to increase in the periods between discharges as the bowl fills with yeast and more and more yeast is carried over into the clarified beer stream.
From a resource efficiency point of view, the objective here is to discharge the yeast from the centrifuge in as concentrated a form as possible while meeting the clarity requirements of the beer being processed. The more concentrated the yeast is, the less beer there is associated with the yeast, and beer is the valuable resource we wish to preserve in this process. It is also likely that any beer associated with waste yeast will ultimately be disposed of to the brewery effluent system, which would either impose an additional load on the brewery’s wastewater treatment plant or that of the local municipality. 
Centrifuges can typically achieve a maximum yeast concentration of 80% by mass in the centrifuge discharge, and it is common practice to dilute this yeast with water to permit pumping.  It is a simple matter to measure yeast concentration in the diluted yeast slurry (through centrifugation in a laboratory) and then to use the alcohol concentration of the supernatant, together with the alcohol concentration of the beer being processed to back-calculate the yeast concentration at the centrifuge discharge. This should generally be done at defined volume intervals over the course of a batch, along with measurements of the yeast count in the incoming beer (expressed as 10^6 cells/ml).   

The factors (outside of design) that impact on the efficiency of a centrifuge are many, and include:
  • Beer flow rate – higher flows reduce the residence time in the centrifuge, which reduces separation efficiency. Also, a centrifuge has a maximum solids (i.e. yeast) removal capacity by virtue of the capacity of the bowl and the maximum discharge frequency permitted. If the rate of solids inflow exceeds this maximum removal capacity, there will be excessive yeast carryover into the clarified beer. The solids inflow rate depends on the beer flow rate and the yeast concentration in the beer being processed. This latter factor can vary significantly over the course of a batch – see my comments about this later.
·    Inlet pressure – high inlet pressures can lead to excessive losses of product, since effectively the volume discharged increases above that desired. Yeast and clarified beer are forced out of the bowl during discharge instead of yeast only.
·    Turbidity set point – clearly, higher set points promote a thicker yeast discharge from the centrifuge. Remember however that the clarity requirements still need to be met.
·    Discharge volume – modern centrifuges are equipped with timers which control the volume discharged (obviously assuming a fixed beer inlet pressure).
·    Operating water pressure – there needs to be sufficient pressure to keep the bowl closed when required, and to close it as quickly as required.
There are also equipment-related factors that can cause the bowl to leak, though such problems can be detected by alarms (e.g. an alarm indicating low bowl speed due to the braking action of the leaking product or an alarm highlighting a reduced back-pressure) and of course, the entire control philosophy employed relies on instruments that are working correctly. A useful way to track centrifuge losses is to measure the frequency of operation of the yeast removal pump, with frequent running indicating large losses. It should be obvious from these points that the various controls available in operating a centrifuge have to be considered in concert.

So what has all this got to do with the need for a systems approach you ask? Centrifuges are typically employed as part of a much bigger process system. For example, consider the use of a centrifuge downstream of fermentation in the lager brewing process. As shown below, the centrifuge would remove yeast remaining in fermented beer, which is then transferred into the storage/maturation process. After storage, the beer is typically filtered and then filled into containers.


Maximisation of the yeast concentration in the discharge of the centrifuge would require the use of a high turbidity set-point, implying significant carryover of yeast into the clarified beer stream.  While some yeast is required for the storage/maturation process to remove residual oxygen and for continued flavour development, too much yeast can cause a range of quality problems, including:
  • Beer haze (cloudy beer and which results in excessive filter circulation, reduced throughput and increased energy and powder consumption at filtration);
  • Foam problems (since yeast contains proteolytic enzymes which can be released into the beer as the yeast autloyses – beer foam is principally comprised of high molecular weight protein materials);
  • Yeasty off-flavours in the final product, which affect drinkability.
Yeast transferred to storage along with the beer being processed will continue to sediment out, and a portion (that which settles out) is typically removed prior to filtration. However, some yeast will remain in suspension and excessive yeast carryover from the centrifuge will translate into a higher yeast count at filtration, and hence a more rapid increase in filter inlet pressure than would be the case with lower yeast counts (assuming the brewery uses constant-flowrate powder filtration). This results in increased product loss at filtration, and overall, losses could therefore be far more than the product “saved” through operating the centrifuge at a high outlet turbidity. In addition to product loss, filtration problems would increase the usage of filter powder (a non-renewable resource), increase the cleaning cycles required per unit volume of beer filtered (incurring increased cleaning chemical and energy usage) and would also increase the electrical energy required (as pressure drop across the beer filter bed increases due to increased yeast load, so does the power required to maintain the required beer flowrate). The point is that the "optimisation" of a centrifuge in isolation can be to the significant detriment of the system within which that centrifuge operates.
Taking this thinking further, this "systems approach" should also extend upstream of the process being optimised. Yeast management practices upstream of the centrifuge can have a significant impact on the resource efficiency of the centrifugation process if we consider that the amount of yeast carried over to storage/maturation can be considered a limiting factor, or constraint. The extent of this carryover depends on the turbidity setpoint employed, as discussed earlier, but also depends heavily on the amount of yeast that is in the beer being processed. Yeast flocculates and then sediments to the bottom of the fermenter once the nutrients required for yeast growth are removed from the green beer. The majority of this yeast is typically removed some time before the beer is transferred through the centrifuge.  Immediately prior to transfer, it is good practice to remove additional sedimented yeast. If this is not done, the first portion of beer being centrifuged will contain an excessive amount of yeast, and even with discharges at maximum frequency, a centrifuge will not be able to achieve the targeted turbidity level since the bowl will fill very quickly. The result could therefore be excessive yeast carryover. As a consequence, the only way that the overall yeast count at maturation could then be achieved would be to run the centrifuge at a low outlet turbidity for the remainder of the transfer, which translates into discharge at low yeast concentration, excessive ejections and therefore excessive loss of product. One control philosophy could be to use an algorithm to reduce the beer flow rate based on a combination of outlet turbidity and discharge frequency (discharge volume could also be varied depending on the capabilities of the centrifuge concerned), but it is still necessary to use good yeast management practices, since otherwise overall brewery throughput could be compromised.  This is particularly true where the transfer process is a constraint.

In conclusion, process losses at breweries are not just about minimising losses in each area, but about finding the right balance between individual areas such that the losses in the overall system are optimised. This logic extends beyond the few limited areas discussed here, and can in fact even be extended to the balancing of  losses in the manufacture of brewing raw materials such as malted barley with how those losses impact on subsequent process losses in brewing. The value of a systems approach in resource efficiency cannot be underestimated, and I will illustrate this further in future posts using examples from other industries. The implications for manufacturing organisations as regards how sustainability performance is measured and managed are fascinating and often counter-intuitive.

Copyright © 2013, Craig van Wyk, all rights reserved

Tuesday, November 1, 2011

Opportunity Knocks for Sustainability-focused Industrial Organisations

The current uncertainty in the economic environment sees many industrial organisations with a significant amount of cash on their balance sheets. Bearish on growth, organisations seem paralysed as to decision-making regarding investments. Organisations which do not have cash  but have access to funding at favourable rates are also loath to invest in the current climate. Building a new factory right now would no doubt be a brave move, but in my view there is an enormous investment opportunity right under the noses of owners of industrial concerns which is largely going untapped: investments in organisational sustainability.  
Projects which save an organisation money while also benefiting the environment are highly desirable, since they have direct relevance to two of the three “pillars” of sustainability. Of course, should these savings be invested in growth, there could be further social benefits through job creation, thereby completing the picture. Sustainability aside however, make no mistake that what we are talking about here is simply good for business, and should be on the radar of any industrial organisation seeking to compete in what is a very trying economic climate.
For clarity, here are a few examples of the types of projects I am talking about:
Ø  Projects which save electrical energy, such as lighting retrofits, installation of energy-efficient induction motors, improvements in refrigeration and heating performance or the appropriate use of variable speed drives;
Ø  Projects which save thermal energy (ultimately fuel-saving projects) such as boiler optimisation and other steam system projects;
Ø  Projects which reduce raw material consumption – these typically have enormous financial benefits as well as very significant life cycle benefits;
Ø  Projects which reduce water consumption and effluent discharges;
Ø  Projects which reduce emissions – most if not all of those above do this too!
Ø  Projects which generate energy from waste streams;
Ø  Projects which reduce solid waste disposal costs and wastes to landfill through for example, recycling or processing of wastes;
Ø  ......you get the picture, the opportunities are endless....

Most of the organisations I work with do not have rigorous processes in place to identify, develop and implement these opportunities, simply because they are not really considered to be the core business of the organisations concerned. The thing is, as the operator of an industrial concern, you are privy to a wonderland of investment opportunities, some of which are unique to your organisation, but many of which are simply best practice. How then do industrial concerns go about finding, developing and implementing these opportunities? In my view this can only be achieved through a rigorous process which has to be continuous.

Have an entrepreneurial mindset
Your organisation can be viewed as the source of prime investment opportunities. Projects which conserve water, energy and materials, add value to waste and by-product streams and reduce regulatory penalties through improved compliance are everywhere. Your aim should be to establish a comprehensive portfolio of these opportunities which can become a live record of every possible conservation opportunity available. In much the same way as you would develop a pipeline of projects for business growth, you should be developing a pipeline of sustainability projects. Sustainability is both a moral imperative as well as a tremendous business opportunity!

Use a standard process to define and measure opportunities
Define the basic steps each project should follow and how you would like your sustainability projects to be measured. Measurement is not just about feasibility, but also about post-implementation performance.  Installing a common process and measurement system allows sustainability projects to be compared and prioritised. Align these processes as far as possible to other change control processes already in place within your organisation – the more integrated you can make sustainability projects, the more likely they are to be accepted and implemented. Note that we are not only talking about technology here, but also projects which involve skill development, changes in management systems/work practices, product and raw material modifications and other drivers of enhanced environmental performance.

Take a Systems Approach
Individual technologies are definitely useful, but analysing systems always yields far larger opportunity than a piecemeal approach. I once conducted a project for an organisation that was far into the process of designing a new effluent treatment plant. The capital and operating costs were going to be significant, but these needed to be incurred in order to meet regulatory requirements. Over the course of the project, we discovered a number of opportunities to conserve raw materials, which ultimately led to large reductions in effluent loading, and ultimately a far smaller effluent treatment plant. By taking an integrated view that considered the manufacturing process together with effluent treatment, costs were saved in both areas. A failure to do this could have resulted in a grossly over-sized treatment plant.

Scan the environment
What is your industry doing as far as sustainability is concerned? What new developments do your OEM’s have to offer? Are there new regulations on the horizon which could impose additional costs on your business? Are there specialist skills your organisation needs which are available in the marketplace? Are there financial incentives available from your government? By knowing what is out there you have a head start in terms of opportunities and threats.  

Develop a network of sustainability partners
Your organisation should build internal capacity as far as possible in terms of the skills necessary to pursue initiatives in resource efficiency and pollution prevention, but it is unlikely that all of the skills required will be available internally. Partner with others in achieving your sustainability objectives. These partners could be your raw material suppliers, OEM’s, suppliers of specialist measuring equipment, research institutions, consulting companies, sister sites within your organisation, financiers and others. If necessary put the requisite confidentiality agreements in place, but by working with leaders in the field you save yourself from reinventing the wheel and also reduce the lead time required to advance along your sustainability journey.

Review continuously
The issues which impact on these projects change continuously. Energy prices fluctuate. Water and waste management costs do too. Technology is evolving continuously. A solution which may not have been feasible a year ago could well be feasible today purely on the basis of the economics, or a new technological innovation could help break a hitherto impenetrable performance barrier. Once you have your portfolio of projects in place, keep going back to individual projects to reassess their viability.

These are just some of my preliminary thoughts on what for me is a fascinating subject. Think about it, your organisation could be sitting on a wealth of improvement opportunities, but may not be realising the benefits. The risks involved are typically lower than traditional financial investments, since in many instances tried and tested approaches can be employed. It is in any event possible to determine the risks of individual projects fairly comprehensively – something that can’t be said about investments in financial markets. And best of all, these projects benefit society, enhance reputation and are in essence the right thing to do.